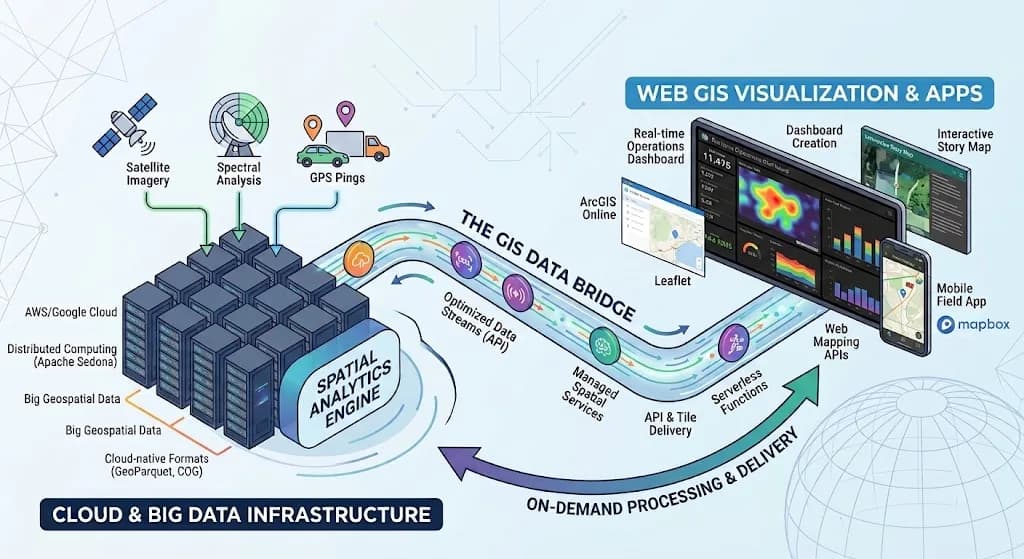
When combined, Web GIS and Cloud & Big Data form the engine behind modern geospatial applications.
In simple terms: Cloud & Big Data serves as the heavy-duty engine and storage back-end, while Web GIS acts as the front-end user interface that displays the insights.
Basic Key components and softwares we need to know
WebGIS:
· ArcGIS Online: Esri’s cloud-hosted SaaS platform for sharing web maps, hosted feature layers, and spatial content across organizations.
· Web Mapping APIs: Frameworks like the ArcGIS Maps SDK for JavaScript to construct fully customized web GIS applications.
· Leaflet: A lightweight, open-source JavaScript library designed for mobile-friendly interactive maps.
· Mapbox: A popular platform offering developer tools, dynamic vector tiles, and modern custom styling via Mapbox GL JS.
· Dashboard Creation: Visual platforms (e.g., ArcGIS Dashboards) that synthesize complex spatial statistics into real-time metrics and charts.
· Story Maps: Storytelling tools (e.g., ArcGIS StoryMaps) that combine interactive maps with text, images, and multimedia content.
Cloud & Big data:
· AWS / Google Cloud: Major cloud infrastructure providers offering scalable virtual machines, object storage (S3, Cloud Storage), and managed spatial databases.
· Distributed Computing: Frameworks such as Apache Spark (with Apache Sedona) or PySpark to parallelize processing across large computer clusters.
· Big Geospatial Data: High-volume data feeds, including real-time vehicle GPS traces, mobile phone location signals, or planetary satellite archives.
· Cloud-Native Formats: Optimized file formats like Cloud-Optimized GeoTIFFs (COG), GeoParquet, and FlatGeobuf that allow queries and partial reads directly from object storage without downloading entire files.
· Serverless GIS: Event-driven serverless architectures (e.g., AWS Lambda, Google Cloud Functions) that automatically trigger spatial processing tasks on demand.
Here is how WebGIS and Cloud & Big Data interact step-by-step:
1. Data Ingestion & Storage (Cloud & Big Data)
Millions of spatial data points (e.g., live vehicle GPS feeds, weather radar, phone location pings) continuously stream into cloud storage like AWS S3 or Google Cloud Storage. To keep queries fast, this data is saved in cloud-native formats such as GeoParquet or Cloud-Optimized GeoTIFFs (COGs).
2. Distributed Processing & Analytics (Cloud & Big Data)
Because the dataset is too massive for a single computer, distributed computing frameworks (like Apache Sedona or PySpark) process the data across cluster nodes. Serverless functions (like AWS Lambda) trigger automatically to run spatial queries—such as aggregate counts or buffer zones—only when requested, keeping costs low.
3. API & Web Tile Delivery (The Bridge)
The processed cloud data is converted into lightweight map tiles or spatial JSON feeds via Web Mapping APIs or map servers. Because cloud-native formats allow partial file reading, the web server only fetches the specific geographic area the user is looking at, rather than loading the whole database.
4. Interactive Visualization (Web GIS)
Front-end mapping libraries like Leaflet, Mapbox GL JS, or ArcGIS Online render the map tiles in the user's web browser or mobile app. The end-user sees real-time updates through interactive Dashboards or Story Maps without experiencing lag, despite millions of underlying records.
Real-World Architectural Example: Ride-Share Live Tracking
Cloud & Big Data: 100,000 drivers stream their live location pings into AWS. Distributed Computing aggregates driver density to identify high-demand areas in real time.
Web GIS: A dispatcher opens an ArcGIS Dashboard or custom Mapbox web app. The web app queries the cloud API and renders a dynamic heat map of driver locations and demand surge zones directly on their browser screen.