If you're new to remote sensing, NDVI is usually the first thing people teach you, and honestly, for good reason. It's simple, it's powerful, and it gives you that "wait, I can actually see this from a satellite?!" moment the first time you run it.
In this post, I'll walk you through what NDVI is, why it matters, and how to calculate it yourself in Google Earth Engine (GEE). Even if you've never written a single line of JavaScript before.
What is NDVI?
NDVI stands for Normalized Difference Vegetation Index. In plain terms, it's a number that tells you how healthy or dense vegetation is in a given area, based on how plants reflect light.
Healthy plants absorb most red light (for photosynthesis) and reflect a lot of near infrared light. Stressed, sparse, or dying vegetation does the opposite. NDVI captures that difference using a simple formula:
NDVI = (NIR - Red) / (NIR + Red)
The output ranges from -1 to 1:
Close to 1 means dense, healthy vegetation
Near 0 means bare soil or sparse vegetation
Negative values usually mean water, snow, or built up areas
Why it matters
NDVI shows up everywhere in real geospatial work. Monitoring crop health, tracking deforestation, studying drought stress, even spotting green space loss in cities over time. It's one of those tools that goes from "textbook concept" to "actually useful" pretty fast, once you see it in action on your own AOI.
Here's a simple script to calculate NDVI using Sentinel-2 imagery for any area you choose.
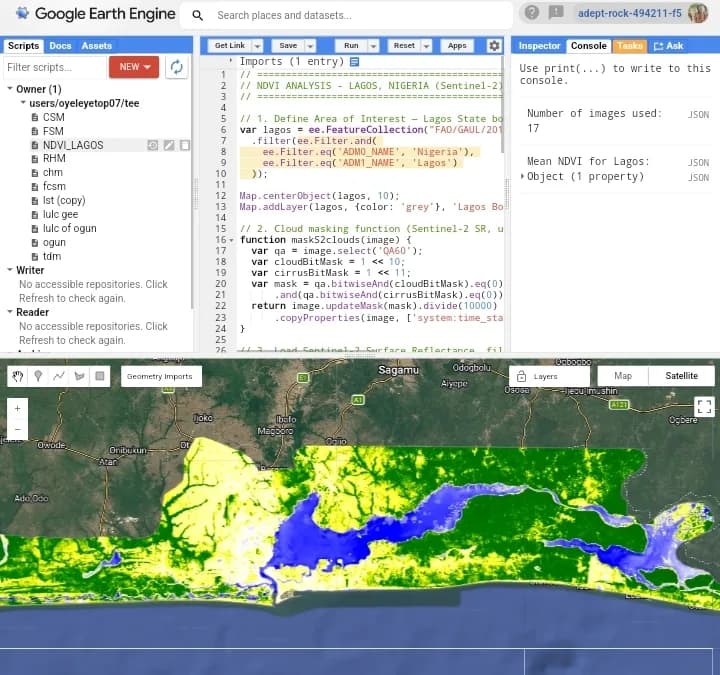
The script below loads cloud free Sentinel-2 imagery over your chosen location, calculates NDVI using the red and near infrared bands, then displays the result as a color coded map.
// Define your area of interest (replace with your own coordinates or draw one on the map)var aoi = ee.Geometry.Point([3.3792, 6.5244]); // Example: Lagos, Nigeria// Load Sentinel-2 surface reflectance datavar dataset = ee.ImageCollection('COPERNICUS/S2_SR') .filterDate('2024-01-01', '2024-12-31') .filterBounds(aoi).filterMetadata('CLOUDY_PIXEL_PERCENTAGE', 'less_than', 10) .median();// Calculate NDVIvar ndvi = dataset.normalizedDifference(['B8', 'B4']).rename('NDVI');// Visualization parametersvar ndviParams = {min: -1, max: 1, palette: ['blue', 'white', 'green']};// Add to mapMap.centerObject(aoi, 10);Map.addLayer(ndvi, ndviParams, 'NDVI');Quick breakdown of what's happening. B8 is the Near-Infrared band, B4 is the Red band, and these are the two NDVI actually needs. The normalized Difference() function does the math for you, so there's no need to type the formula manually. The palette turns your result into an easy to read map: blue for water, white or tan for bare ground, green for healthy vegetation.
A few tips for beginners
Always filter for cloud cover first. Cloudy pixels will mess up your results, and you don't want to be debugging a "why does my map look wrong" issue that's really just clouds
Try adjusting the date range to compare seasons. Dry vs rainy season NDVI can look completely different, especially in tropical regions
Once you're comfortable, run this on your own city, farm, or hometown. Seeing your own environment mapped out hits different, trust me
Final thoughts
NDVI is a small piece of a much bigger toolkit in geospatial analysis, but it's the perfect place to start. Get comfortable with this, and concepts like NDWI (water index) or LST (land surface temperature) will feel a lot less intimidating afterward.
If you're just getting into GIS or remote sensing, don't just read this. Open GEE and run the script yourself on a location you know. Nothing beats learning by doing.